
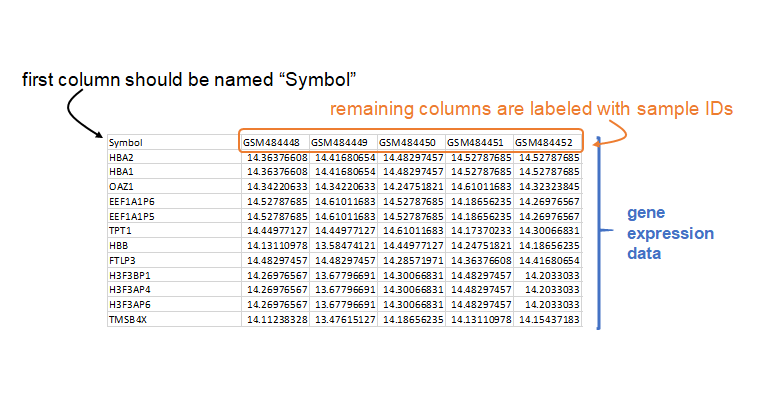
To run the MDP, you must supply expression data and phenotypic data. The expression data is a tab-delimited text table that contains an initial column named "Symbol" with the rows containing unique gene annotation, and other columns containing gene expression data and sample names in the header.
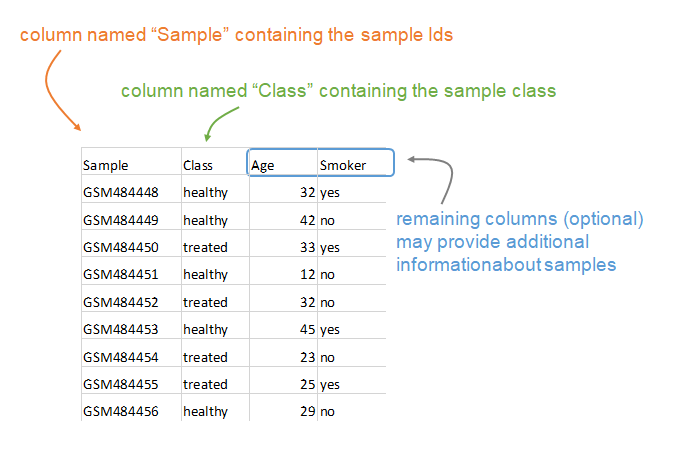
The phenotypic information is also a tab-delimited text table that contains at least two columns. The “Sample” column contains sample IDs (which should correspond to the columns in the expression file) and the “Class” column contains the phenotypic information used by the MDP. Other columns can be provided that contain additional phenotypic information.
Once the data are uploaded, you can select the label that corresponds to the control class.
There are some optional parameters that you can select that will affect how the sample scores are calculated. You can select the statistics average method, which is the method (median or mean) that will be used to compute the average value of each of the control genes.
You can also choose the standard deviation threshold, which controls the threshold at which the normalized gene expression scores are set to zero.
You can also change the percentage of genes that will contribute to sample scores. Genes are ranked in accordance to their average normalized expression scores in the test classes relative to the controls. You can decide what top percentage of these perturbed genes will be used to compute the sample scores.
If you want to use gene sets to calculate the sample scores, upload the .gmt file in Pathways file (Optional) and select what is gene set will be used for MDP analysis. The .gmt format file contains gene sets are arranged across the rows. The first column contains the pathway name, the second column contains a shorter description or a dummy field ("NA"), and the remainder of each row contains the gene symbols in that pathway. Rows can have unequal length. More details about .gmt format see link here.