
The Molecular Degree of Perturbation webtool quantifies the heterogeneity of samples within a group using transcriptome data. It takes data containing at least two classes (control and test) and assigns a score to all samples based on how perturbed they are compared to the controls. Perturbation can be an infection, drug treatment, siRNA silencing, vaccination, and any type of disease. The MDP analysis is useful for gene expression data, as well as proteomic and metabolomic data, that have control and test samples in the same dataset. The more control and test samples that you have (ideally at least 10), the more accurate the calculation sample scores.
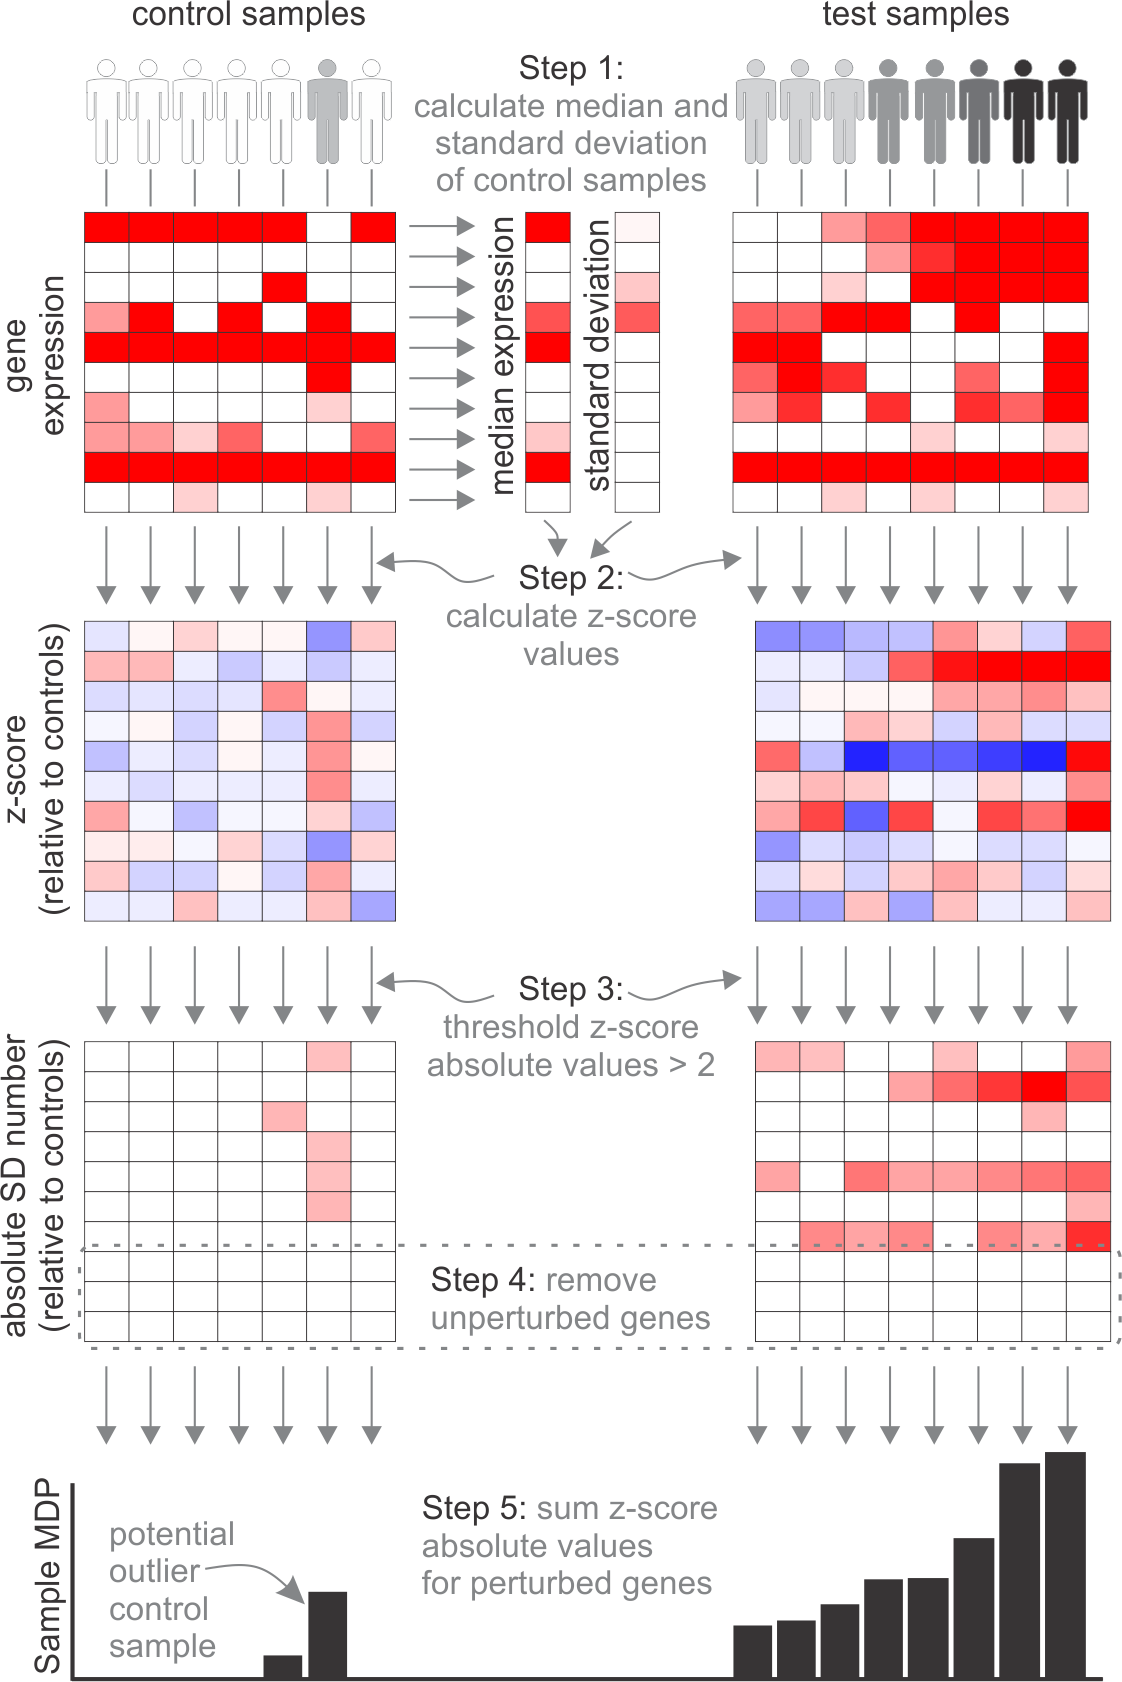
The design of the algorithm is based on the Molecular Distance to Health which was first described by Pankla et al. 2009. The MDP, by comparison, does not discretize the Z-score normalised gene scores. We also allow you to use the mean to calculate the average gene expression, so that the gene average is less sensitive to outliers. You can also select the standard deviation threshold.
The MDP utilizes the ggplot2 R package - https://CRAN.R-project.org/package=ggplot2